ThatOneKrazyKaptain@lemmy.world to Neoliberal@lemmy.worldEnglish · 5 months agoDemocratic Vice President Betting Oddslemmy.worldimagemessage-square5fedilinkarrow-up15arrow-down14
arrow-up11arrow-down1imageDemocratic Vice President Betting Oddslemmy.worldThatOneKrazyKaptain@lemmy.world to Neoliberal@lemmy.worldEnglish · 5 months agomessage-square5fedilink
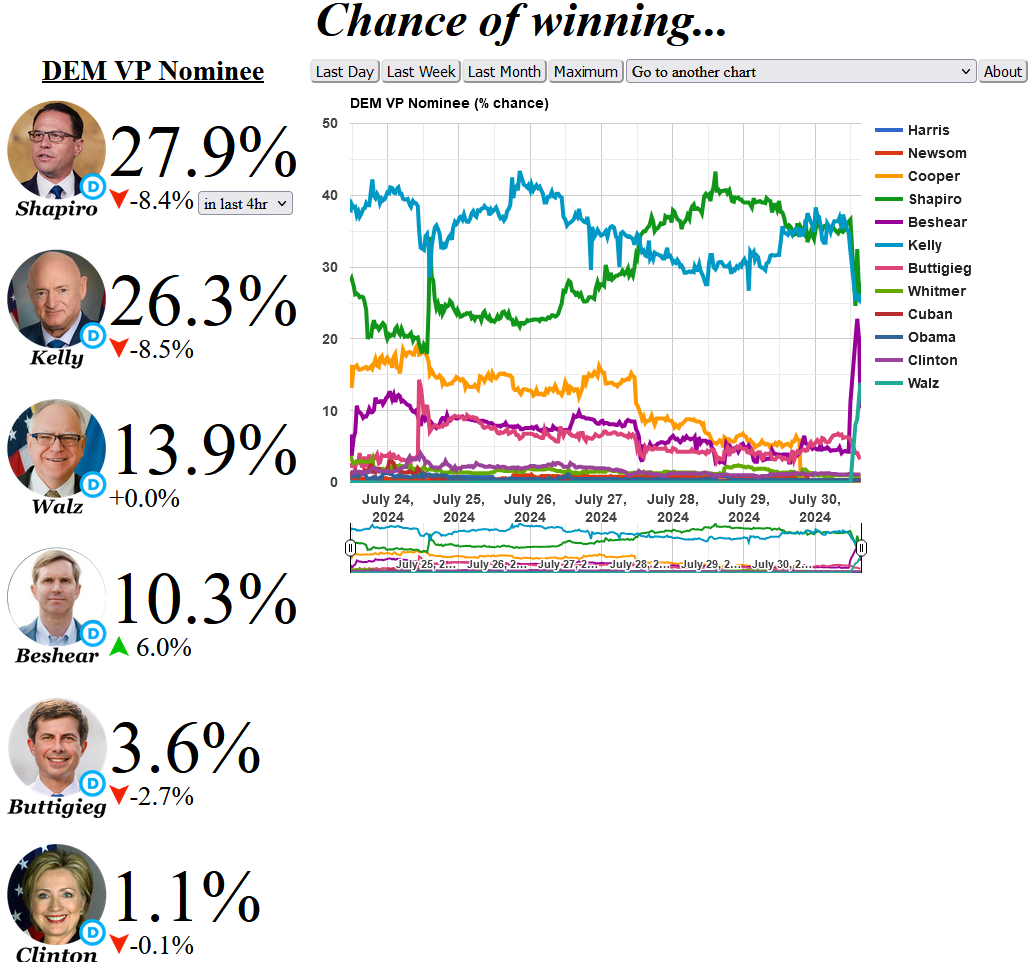
minus-squareinspectorstMlinkfedilinkEnglisharrow-up4·5 months agoThe chart is the betting-implied probability (=1/the odds). There’s a direct relationship between the two. I reckon most people would understand this given the chart of clearly labelled as the probability.


The chart is the betting-implied probability (=1/the odds). There’s a direct relationship between the two. I reckon most people would understand this given the chart of clearly labelled as the probability.