- 28 Posts
- 36 Comments

Never felt like 55% though…


 1·2 years ago
I think the ULEZ chat is expectation management from Labour, for if they win by less than they would have hoped to be convincing and to drive a narrative, especially if Selby is a nail biter. But then 1000 seats was expectation management by the tories inthe local elections and look how that went
If you’re interested:
It does depend on how much people just ‘go labour’ because thats the ‘not tory’ vote, and how many look at their constituency and see Lib Dems in second, Labour can’t actually fight everywhere with ground game, and in many places they won’t really want to mand Lib Dems can and will do.
I haven’t played with the tactical voting bit of Electoral Calculus mostly because it is a nationwide value and the regions will differ so much in who they vote if they are voting ‘not tory’. Wales and North go Labour far more just as a baseline, East, South and South-West go Lib Dem more but not in cities, London does Labour, Lib Dem and Green in different ratios depending on borough.
It’s all a bit of a fun nightmare to try that’s also a guess and there’s no public tools (I know of) to try it even if you wanted to, which I kinda do; as any level of tactical voting hammers the Tories even more than these predictions and that’s always fun to see.
Oh I don’t dare underestimate the change in public opinions when it’s election time and suddenly their vote is close and they have to think. I know it happened for Labour in 2017 and a bit in 2019, but it can happen either way.
Don’t get me wrong, Labour could coast into a comfy majority the way things are looking atm.
And those poor Lib Dems, I do think they are being underestimated by the models, but it doesn’t look amazing for them eh.
I think whats worse is, looking at and putting in the regional info from their data table, other than the Wales Green party numbers…this one actually feels right, loads of other polls the Scotland numbers have been all over the place, low numbers of people and odd % turning up, but this one doesn’t have anything glaring out at me that’s horrifically and clearly sampling error, even Flavible’s more uniform and conservative model is absolutely brutal at these numbers, and these numbers are what, 1-2% up or down from the average over the last week or so.
This is BEFORE we have an election campaign and Purdah, we know Rishi isn’t the greatest campaigner and he clearly doesn’t like questions, PMQs or being questioned and that all thats going to happen to him for WEEKS during the election.
Dare we start to hope?
 2·2 years ago
This whole thing is fascinating not for the whole Huw Edwards bit, but for the all the editorial decisions in The Sun. I mean, what were they thinking?

cryptographic nonces
Until this day I had never seen this term before…time for the Brits to mold it into a cracker of an insult.
and yeah nonce means pedo here; depending on the surrounding swear words

Flavible:
Party Pred % Pred Seats CON 🌳 28.0% 199 LAB 🌹 43.0% 365 LD 🔶 9.0% 28 REFUK ➡️ 8.0% 0 Green 🌍 6.0% 1 SNP 🎗️ 3% 33 PC 💮 0.5% 3 Electoral Calculus (2023 Boundaries’):
Party 2019 Votes 2019 Seats Pred Votes Gains Losses Net Change Pred Seats CON 🌳 44.7% 375 28.0% 9 213 -204 172 LAB 🌹 33.0% 198 43.0% 233 0 +233 430 LIB 🔶 11.8% 8 9% 8 0 +8 16 Reform ➡️ 2.1% 0 8% 0 0 +0 0 Green 🌍 2.8% 1 6% 0 0 +0 1 SNP 🎗️ 4.0% 48 3.0% 0 38 -38 10 PlaidC 💮 0.5% 2 0.5% 1 1 +0 2 Other ⬜️ 1.1% 0 2.5% 1 0 +1 1 N.Ire ⬜️ - 18 - 0 0 +0 18 Scotland EC Break-Down
Con Lab Lib REF Green SNP 28% 31% 3% 1% 3% 31% Don’t believe the Scots numbers for a second in this poll; and they are having a real impact on the EC seat numbers.
“Nothing to report sir; just a meaningless and ever increasingly large and dense cluster of outliers”
Those poor LibDems though…
Flavible:
Party Pred % Pred Seats CON 🌳 25.0% 129 LAB 🌹 51.0% 435 LD 🔶 8.0% 29 REFUK ➡️ 5.0% 0 Green 🌍 5.0% 1 SNP 🎗️ 3% 31 PC 💮 0.5% 3 Electoral Calculus (2023 Boundaries’):
Party 2019 Votes 2019 Seats Pred Votes Gains Losses Net Change Pred Seats CON 🌳 44.7% 376 25.0% 1 325 -324 52 LAB 🌹 33.0% 197 51.0% 338 0 +338 535 LIB 🔶 11.8% 8 8% 8 0 +8 16 Reform ➡️ 2.1% 0 7% 0 0 +0 0 Green 🌍 2.8% 1 6% 0 0 +0 1 SNP 🎗️ 4.0% 48 3.5% 0 15 -23 25 PlaidC 💮 0.5% 2 0.4% 1 1 +0 2 Other ⬜️ 1.1% 0 2.0% 1 0 +1 1 N.Ire ⬜️ - 18 - 0 0 +0 18
Flavible:
Party Pred % Pred Seats CON 🌳 22.0% 95 LAB 🌹 47.0% 453 LD 🔶 9.0% 43 REFUK ➡️ 9.0% 0 Green 🌍 7.0% 1 SNP 🎗️ 3% 33 PC 💮 0.5% 3 Electoral Calculus (2023 Boundaries’) *updated with Scotland as full tables are available:
Party 2019 Votes 2019 Seats Pred Votes Gains Losses Net Change Pred Seats CON 🌳 44.7% 375 22.0% 0 313 -313 63 LAB 🌹 33.0% 198 47.0% 328 0 +328 525 LIB 🔶 11.8% 8 9% 12 0 +12 20 Reform ➡️ 2.1% 0 9% 0 0 +0 0 Green 🌍 2.8% 1 7% 0 0 +0 1 SNP 🎗️ 4.0% 48 3.2% 3 31 -28 20 PlaidC 💮 0.5% 2 0.4% 1 1 +0 2 Other ⬜️ 1.1% 0 2.3% 1 0 +1 1 N.Ire ⬜️ - 18 - 0 0 +0 18 Scotland EC Break-Down 👀
Con Lab Lib REF Green SNP 13% 36% 9% 2% 5% 33% PrincipleFish
[Broad Region breakdown used here]

Stealing my self appointed job!!
Flavible:
Party Pred % Pred Seats CON 🌳 26.0% 156 LAB 🌹 47.0% 402 LD 🔶 10.0% 35 REFUK ➡️ 6.0% 0 Green 🌍 5.0% 1 SNP 🎗️ 3% 31 PC 💮 0.5% 3 Electoral Calculus (2023 Boundaries’):
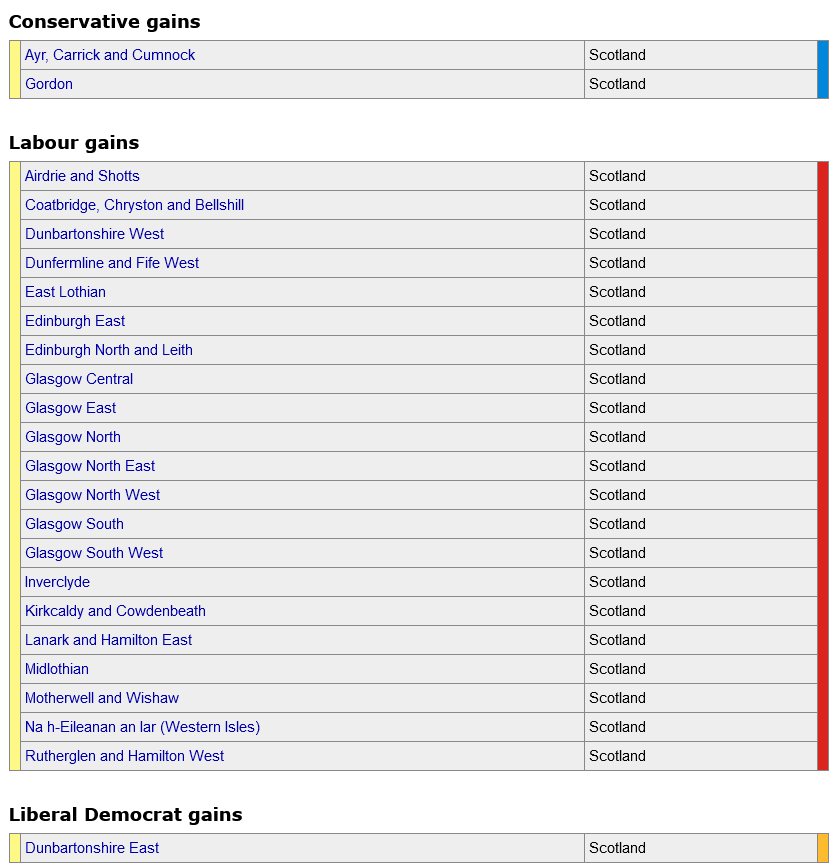
Party 2019 Votes 2019 Seats Pred Votes Gains Losses Net Change Pred Seats CON 🌳 44.7% 376 26.0% 1 282 -281 95 LAB 🌹 33.0% 197 47.0% 293 0 +293 490 LIB 🔶 11.8% 8 10% 10 0 +10 18 Reform ➡️ 2.1% 0 6% 0 0 +0 0 Green 🌍 2.8% 1 5% 0 0 +0 1 SNP 🎗️ 4.0% 48 3.5% 0 23 -23 25 PlaidC 💮 0.5% 2 0.4% 1 1 +0 2 Other ⬜️ 1.1% 0 0.1% 0 0 +0 1 N.Ire ⬜️ - 18 - 0 0 +0 18 That Con gain is Moray West, Nairn and Strathspey ‘from SNP’ but is a new seat for 2023.
General election 2019: Tamworth
Party Candidate Votes % ±% Conservative Chris Pincher 30,542 66.3 +5.3 Labour & Co-op Chris Bain 10,908 23.7 –11.1 Liberal Democrats Rob Wheway 2,426 5.3 +1.1 Green Andrew Tilley 935 2.0 New UKIP Robert Bilcliff 814 1.8 New Independant John Wright 431 0.9 New Majority 19,634 42.6 +16.4 Turnout 46,056 64.3 –1.8 Conservative hold Swing +8.2 The mountain to Climb FYI. And a rare 2019 UKIP showing too. Current Nowcast prediction below:
PrincipleFish

Electoral Calculus

Flavible:
Party Pred % Pred Seats CON 28.0% 177 LAB 46.0% 380 LD 11.0% 35 REFUK 4.0% 0 Green 4.0% 1 SNP 3% 32 PC 0.5% 3 Electoral Calculus (2023 Boundaries’):
Party 2019 Votes 2019 Seats Pred Votes Gains Losses Net Change Pred Seats CON 44.7% 375 28.0% 1 236 -235 141 LAB 33.0% 198 46.0% 248 0 +248 445 LIB 11.8% 8 11% 9 0 +9 17 Reform 2.1% 0 4% 0 0 +0 0 Green 2.8% 1 4% 0 0 +0 1 SNP 4.0% 48 3.5% 0 23 -23 25 PlaidC 0.5% 2 0.5% 1 1 +0 2 Other 1.1% 0 3.0% 0 0 +0 0 N.Ire - 18 - 0 0 +0 18 The difference 28% Con vs 24-5% Con is quite something. Still puts Labour in or close to the 400 Club (again).
This iconic duo also has spritz of misogyny just for extra flavour


I have a feeling (because I know nothing) that EC and PrincipleFish either use a uniform swing approach or a very lightly weighted model, where as Flavible and EC have an actual weighted model but even then the models can’t really account for the pull of an individual MP and their…electoral inertia?
Paisley is a real Labour target but Mhairi’s majority is big enough that it isn’t caught by uniform swings and the weighted models aren’t picking it up on these numbers probably/possibly because the model isn’t updated with he rnot standing…or, the weighting for incumbent MP and/or popular incumbent MP is basically a finger in the air educated guess from the model creator, which isn’t really a model.
But what do I know
Flavible:
Party Pred % Pred Seats SNP 35.0% 18 LAB 32.0% 29 CON 21.0% 7 LD 7.0% 5 REFUK 2.0% 0 Green 2.0% 0 Turns out I’m an idiot and Flavible do let you select Scotland Only, different story from them and the others.
PrincipleFish & ElectionPolling.co.uk


AFAIK that’s one half of the story, but the other is something quite technical and cool in zoology that wasn’t foreseen by ecologists at the time wolves were eradicated.
The wolves being removed caused something called meso-predator release, whereby the coyote numbers in the Yellowstone surged because of the cross over in prey species and lack of competition for that prey. BUT, that meant species not shared with wolves had their numbers heavily reduced by the increase in coyotes, mainly beavers.
When beaver numbers plummeted so did dams along the Yellowstone, and the the water level of the river went down and I think sped up, and that reduced areas for all animals and vegetative growth along the whole river. Reintroducing wolves caused coyote numbers to stabilise back at regular levels, beaver numbers did the same and the river stared to go back normal causing a huge bounce back across the board. Including reducing deer numbers back as coyotes don’t hunt them so they did the opposite of beavers when wolves were removed for the same reason… Meso-predator release but in the opposite direction.