🚨🚨New Voting Intention🚨🚨 Labour lead is twenty-four percentage points in the latest results from Deltapoll.
Con 24% (-4)
Lab 48% (+2)
Lib Dem 11% (+2)
Other 17% (-1)
Fieldwork: 14th - 17th July 2023 | Sample: 1,000 GB adults | (Changes from 7th-10th July 2023)
Flavible:
| Party | Pred % | Pred Seats |
|---|---|---|
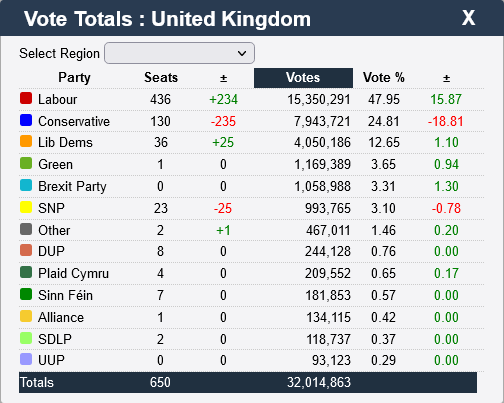
| CON 🌳 | 24.0% | 119 |
| LAB 🌹 | 48.0% | 425 |
| LD 🔶 | 11.0% | 47 |
| REFUK ➡️ | 6.0% | 0 |
| Green 🌍 | 5.0% | 1 |
| SNP 🎗️ | 3% | 32 |
| PC 💮 | 1% | 4 |
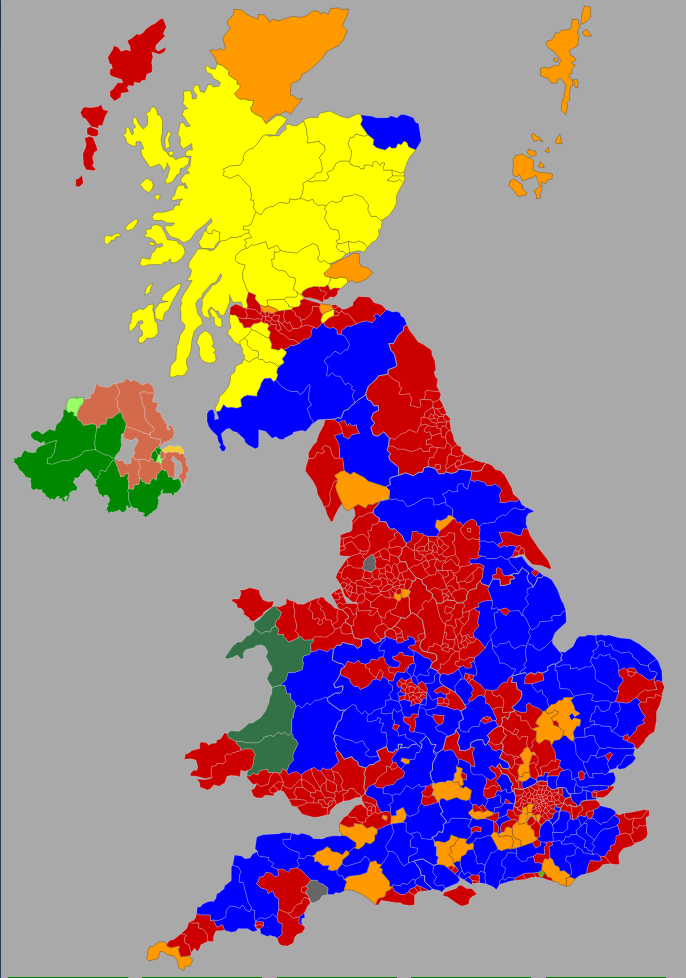
Electoral Calculus (2023 Boundaries’):
| Party | 2019 Votes | 2019 Seats | Pred Votes | Gains | Losses | Net Change | Pred Seats |
|---|---|---|---|---|---|---|---|
| CON 🌳 | 44.7% | 376 | 24.0% | 0 | 309 | -309 | 67 |
| LAB 🌹 | 33.0% | 197 | 48.0% | 320 | 0 | +320 | 517 |
| LIB 🔶 | 11.8% | 8 | 11% | 13 | 0 | +13 | 21 |
| Reform ➡️ | 2.1% | 0 | 6% | 0 | 0 | +0 | 0 |
| Green 🌍 | 2.8% | 1 | 5% | 0 | 0 | +0 | 1 |
| SNP 🎗️ | 4.0% | 48 | 3.3% | 4 | 29 | -25 | 23 |
| PlaidC 💮 | 0.5% | 2 | 0.5% | 1 | 1 | +0 | 2 |
| Other ⬜️ | 1.1% | 0 | 2.2% | 1 | 0 | +1 | 1 |
| N.Ire ⬜️ | - | 18 | - | 0 | 0 | +0 | 18 |
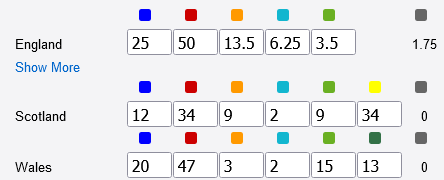
Scotland EC Break-Down
| Con | Lab | Lib | REF | Green | SNP |
|---|---|---|---|---|---|
| 12% | 34% | 9% | 2% | 9% | 34% |
PrincipleFish


It does depend on how much people just ‘go labour’ because thats the ‘not tory’ vote, and how many look at their constituency and see Lib Dems in second, Labour can’t actually fight everywhere with ground game, and in many places they won’t really want to mand Lib Dems can and will do.
I haven’t played with the tactical voting bit of Electoral Calculus mostly because it is a nationwide value and the regions will differ so much in who they vote if they are voting ‘not tory’. Wales and North go Labour far more just as a baseline, East, South and South-West go Lib Dem more but not in cities, London does Labour, Lib Dem and Green in different ratios depending on borough.
It’s all a bit of a fun nightmare to try that’s also a guess and there’s no public tools (I know of) to try it even if you wanted to, which I kinda do; as any level of tactical voting hammers the Tories even more than these predictions and that’s always fun to see.