

cross-posted from: https://lemmy.world/post/5586412
Fig. 2: Relative environmental footprint from GHG emissions of diet groups in comparison to high meat-eaters (>100 g d−1).
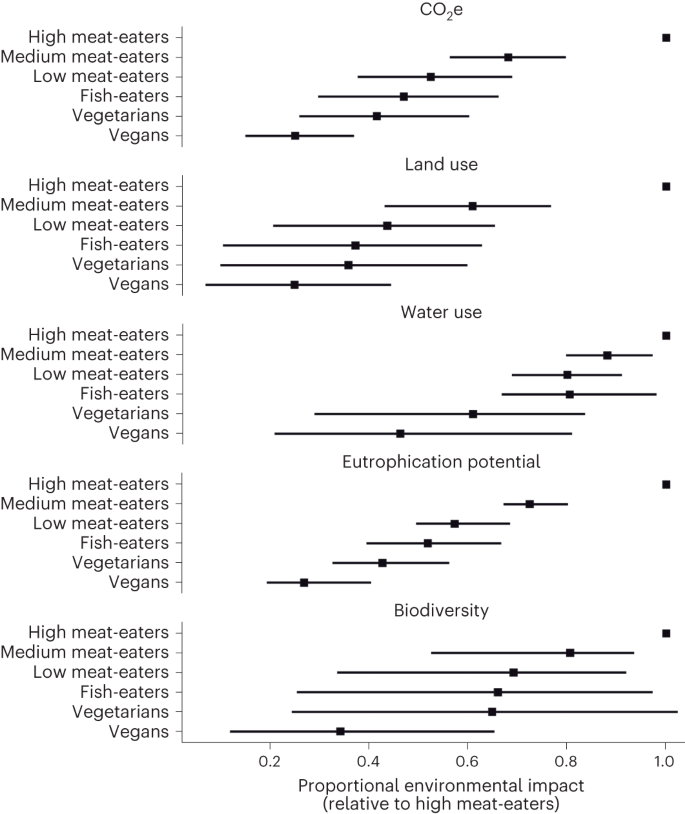
Fig. 3: Relative environmental footprint from GWP100, land use, water use, eutrophication potential and biodiversity impact of diet groups in comparison to high meat-eaters (>100 g d−1).

But would that be just beef, or beef and milk and cheese and leather so all cow products?
It was broken down into individual elements, IIRC… found it…
https://philsturgeon.com/content/images/2023/04/foods-carbon-footprint-7.jpg
Meat Lover -> No Beef alone is 3.3 -> 1.7, or 80% of the saving you get by going vegetarian (so I was slightly misremembering on my original post).
Full article:
https://philsturgeon.com/unf-king-the-climate-food/